
Titanium vs carbon: we measured how a bike feels - in the brain
Nineteen riders. Two frames, titanium and carbon. Continuous mobile EEG on a closed forest course. The question a client couldn't answer with marketing, we answered with a measurement.

The study at a glance
THE CHALLENGE
The question you can't answer with marketing
Pilot - Titanium Bicycles builds titanium frames by hand, and wanted an honest answer to a hard question: do riders actually feel better on titanium, or does it just sound good in a brochure?
Association research we had previously carried out for Pilot had already turned up something striking. Compared with carbon, titanium was linked far more strongly with trust - and far less with the fear of a frame breaking or getting damaged. On both attributes the two materials sat more than 120 points apart. That raised a genuinely testable question: if titanium feels psychologically safer, does that show up as measurable wellbeing while you ride?
You can't settle that with marketing. So Pilot brought it to us - and left the outcome open in advance.
Marketing tells a story. A measurement shows what really happens.
THE APPROACH
Nineteen riders, two frames, one honest test
We designed a strictly within-subject field study - the fairest way to compare. Every rider rode the same closed forest test course twice, once on carbon and once on titanium, while we recorded their brain activity continuously with 24-channel mobile EEG. Because each person rides both frames, each rider is their own control.
Our primary measure was frontal alpha asymmetry (FAA), the long-established EEG marker of approach motivation and wellbeing. To sidestep the best-known criticism of that measure, we ran the main analysis on a reference-free surface Laplacian (CSD). We corrected for speed, aligned brain and video to within two seconds, and stress-tested every result with sensitivity analyses.
WHAT WE FOUND
The clear answer: no measurable difference in wellbeing
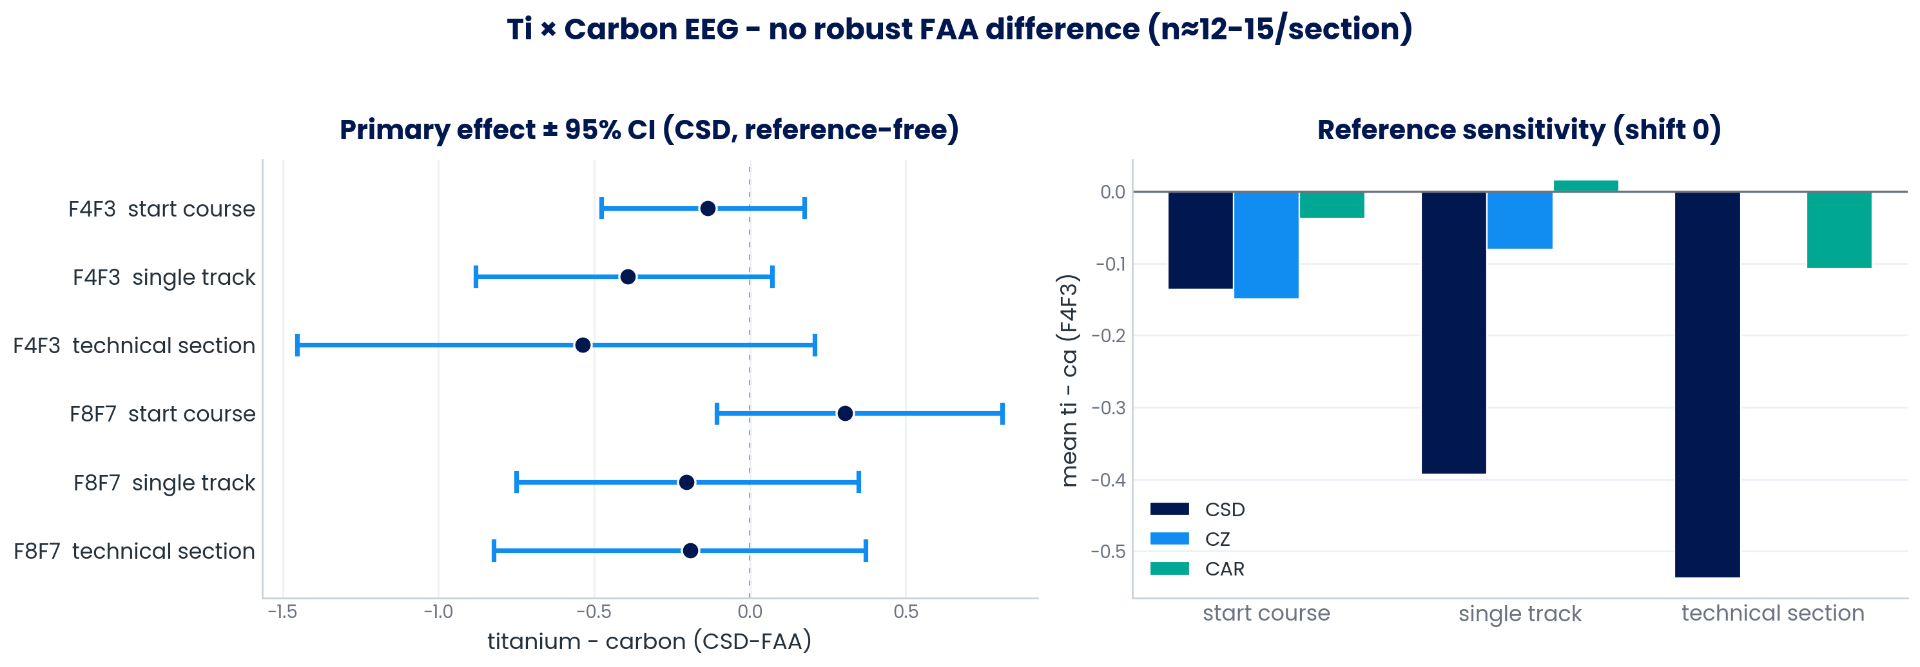
Across six pre-specified tests, not one reached significance. In every section of the course the 95% confidence interval included zero, and the picture held whether we changed the reference or shifted the alignment. On our primary brain measure, the two bikes were simply indistinguishable.
The old mechanical assumption didn't hold either: the stiffer carbon left no measurable vibration or muscle signal in the EEG. There was no "buzz" to see.
THE TWIST
The rider matters more than the bike
Here is the result that stopped us. The most interesting difference in the data wasn't titanium versus carbon at all.
Look at two riders' brain maps. Within a single rider, carbon and titanium look almost identical - the frame barely moves the picture. But between riders, the maps look nothing alike. The differences between people were many times larger than the difference between the two bikes.
In other words: how a bike feels depends far more on you, and on the moment, than on the material of the frame.
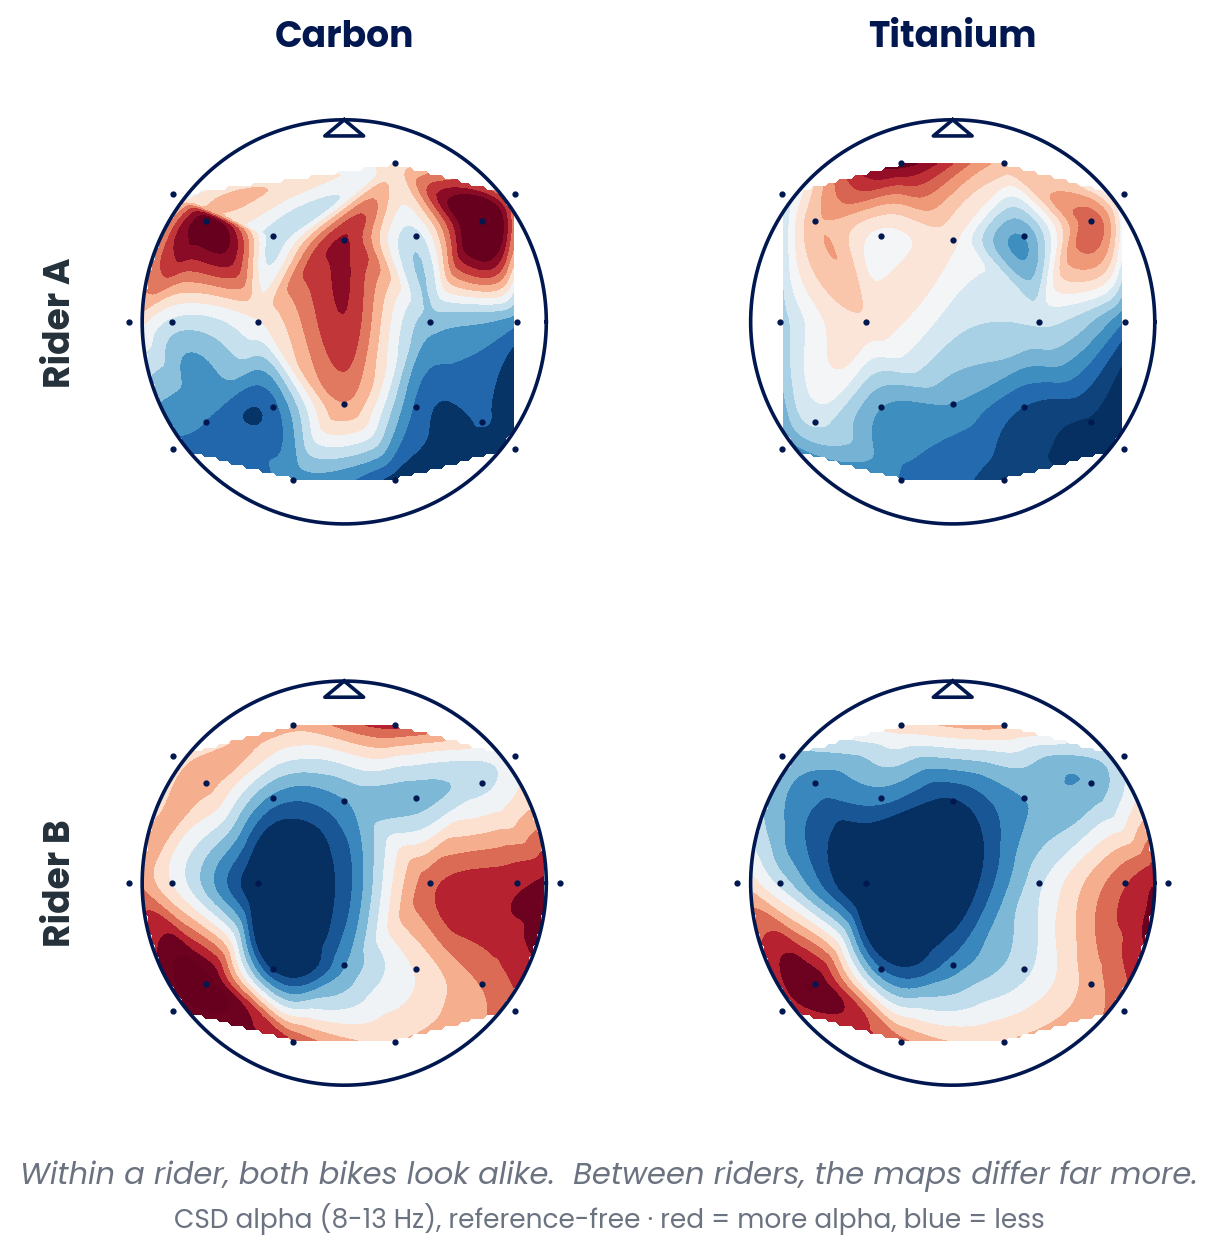
Every rider experiences a bike in their own way.
THE LEAD
One honest lead: noticeably calmer steering on titanium
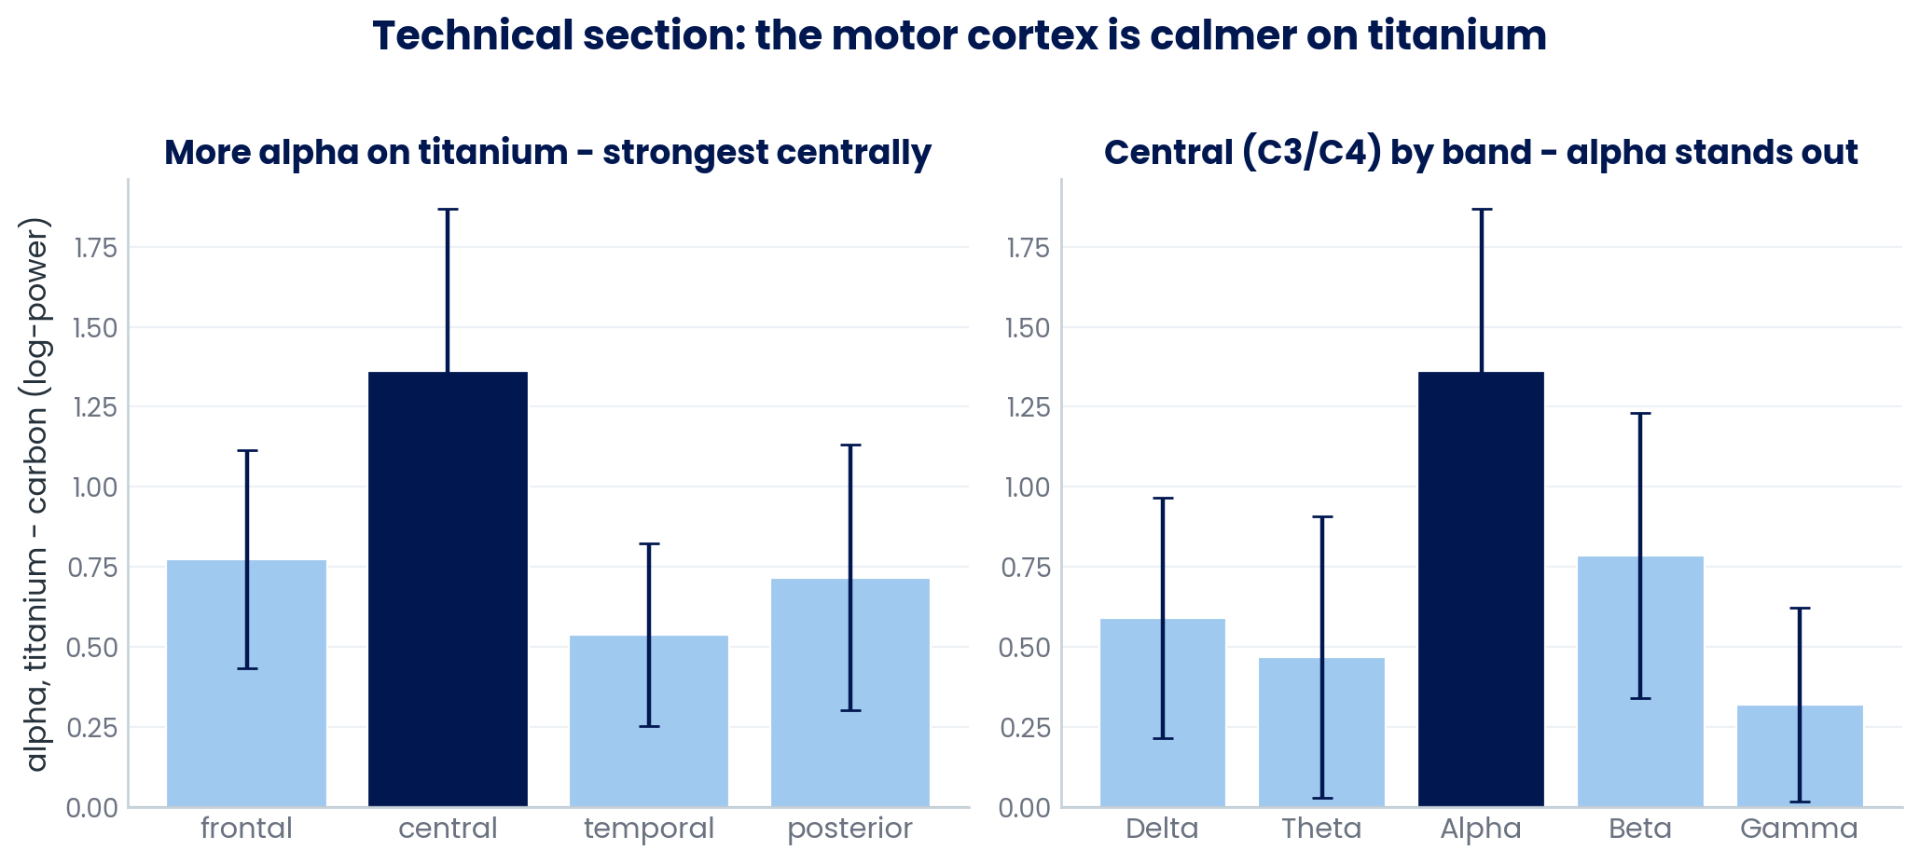
There was one place we did see a signal - the hardest, most technical part of the course. There, the motor cortex showed more central alpha, the so-called mu rhythm, on titanium. More mu means the motor system is idling rather than bracing: a calmer, less white-knuckled hand on the tricky bit.
We're deliberately careful with this one. It's exploratory - a single short segment, and it does not survive strict correction for multiple comparisons. It is not a settled result. It is the lead we're carrying into a pre-registered follow-up, where the design and hypothesis are fixed in public before we measure, so the outcome can just as easily refute it.
Exploratory finding - labelled honestly as a lead, not a conclusion. Going into a pre-registered follow-up.
HOW WE WORK
Why we published a "no difference"
A null result isn't a failure. It's an honest answer - and honesty is the whole point.
Pilot commissioned the study, but the outcome was open from the start: the design, the analysis and the reporting were entirely ours, independent, whatever the result. A null result means "no evidence for a difference," not "proof the bikes are equal" - and a small effect isn't ruled out. That discipline is exactly what makes a positive result, when it comes, worth trusting.
WHAT THIS MEANS FOR YOU
Real-world neuroscience, wherever experience happens
This is what Neurofactor does. We take neuroscience out of the lab and into the real world - from the brain in front of the Girl with a Pearl Earring, to a driver in a McLaren at speed, to a skydiver in freefall, and here, out onto a forest trail.
If you have a product, an environment or an experience and you want to know how it actually lands - not what people say in a survey, but what the brain does in the moment - we can measure it, and we'll tell you honestly what we find.
Measure what your customers really experience
Tell us what you want to understand and we'll design the measurement.
Frequently asked questions
DOWNLOADS
Download the full research media kit
The complete media kit - full research report, methodology, figures and press assets. Leave your first name and email and we'll email you a copy, and start the download right away.